Logs & Alerts
Logs Overview
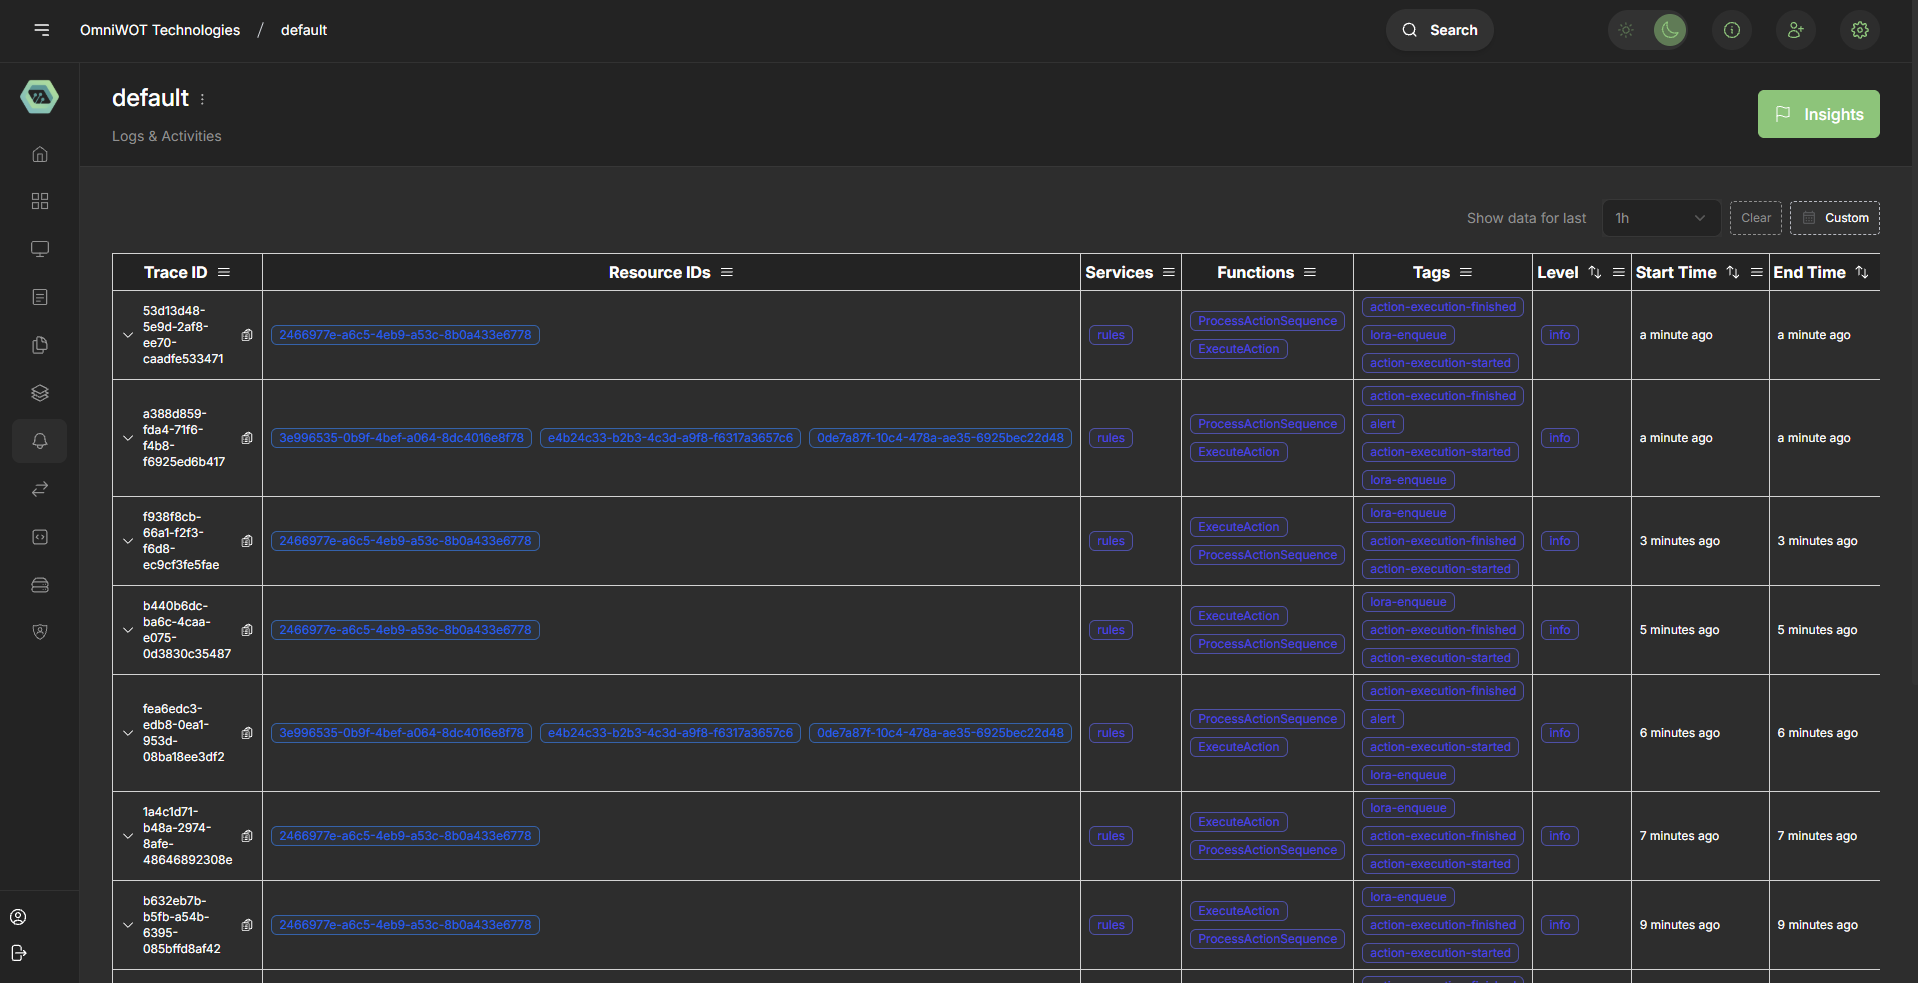
The OmniWOT logging system provides comprehensive distributed tracing and activity monitoring capabilities. The logs interface presents a structured view of system operations, resource tracking, and execution flows through a web-based dashboard.
Log Structure
Trace Information
The logging system organizes activities into traces, which represent complete request or operation flows through the system.
Trace ID Format
- Structure: Alphanumeric identifier (e.g.,
ec19d1d9-5003-cc54-9277-6156ed71155) - Purpose: Unique identifier for tracking a complete operation across multiple services
- Display: Expandable rows showing related activities
Core Data Fields
1. Resource IDs
- Format: UUID-based identifiers in blue pill format
- Examples:
2460977e-a6c5-4eb9-a53c-8b0a433e6778e7ae3e88-c5f1-4016-8e3d-05f9251033683e996535-0b9f-4bef-a064-8dc4018a8f78
- Purpose: Identifies specific resources involved in operations
- Relationship: Multiple Resource IDs can be associated with a single trace
2. Services
- Primary Service:
rules - Display: Consistent blue pill format
- Function: Indicates which service component handled the operation
3. Functions
The system tracks two main function types:
- ProcessActionSequence: Handles action workflow orchestration
- ExecuteAction: Manages individual action execution
4. Tags
Comprehensive tagging system for operation categorization:
Execution State Tags
action-execution-finished: Completed action executionaction-execution-started: Initiated action executionlora-enqueue: LoRA (Low-Rank Adaptation) queuing operations
Alert Tags
alert: System alerts and notifications
Timing Tags
- Multiple timing-related tags for performance monitoring
5. Temporal Information
- Level: Severity or importance indicator (shows "info" level)
- Start Time: Operation initiation timestamp (displays as "an hour ago")
- End Time: Operation completion timestamp (displays as "an hour ago")
Log Entry Examples
Standard Trace Entry
Trace ID: ec19d1d9-5003-cc54-9277-6156ed71155
Resource ID: 2460977e-a6c5-4eb9-a53c-8b0a433e6778
Service: rules
Functions: ProcessActionSequence, ExecuteAction
Tags: action-execution-finished, lora-enqueue, action-execution-started
Multi-Resource Trace Entry
Trace ID: a32519e4-f35c-4b51-69b3-33160e3776a2
Resource IDs:
  - 3e996535-0b9f-4bef-a064-8dc4018a8f78
  - e4b24c33-b2b3-4c3d-a9f8-f6317a3657c6
  - 0de7a87f-10c4-478a-ae35-6925bec22d48
Service: rules
Functions: ProcessActionSequence, ExecuteAction
Tags: action-execution-finished, alert, action-execution-started, lora-enqueue
User Interface Features
Table Structure
The logs are presented in a sortable table format with the following columns:
- Trace ID: Expandable identifier with copy functionality
- Resource IDs: Multiple resource associations
- Services: Service component identification
- Functions: Operation type classification
- Tags: Categorization and state indicators
- Level: Log severity level
- Start Time: Operation initiation timestamp
- End Time: Operation completion timestamp
Interactive Elements
- Expandable Rows: Click trace IDs to expand detailed information
- Copy Functionality: Quick copy buttons for trace and resource IDs
- Sortable Columns: Click column headers to sort data
- Tag Filtering: Visual tag system for quick identification
Common Patterns
Action Execution Flow
Most traces follow a consistent pattern:
- action-execution-started: Initiation of an action
- lora-enqueue: Queuing for LoRA processing
- action-execution-finished: Completion of action execution
Multi-Resource Operations
Some operations involve multiple resources simultaneously, indicated by:
- Multiple Resource ID pills in the same trace
- Consistent service and function associations
- Similar tag patterns across resources
Monitoring and Troubleshooting
Key Indicators
- Completion Status: Look for
action-execution-finishedtags - Alert Conditions: Monitor for
alerttags - Resource Associations: Track resource relationships through IDs
- Timing Information: Monitor start/end time patterns
Performance Metrics
- Duration: Calculate operation duration from start/end times
- Throughput: Monitor trace frequency and completion rates
- Resource Utilization: Track resource ID usage patterns
Best Practices
Log Analysis
- Trace-Based Investigation: Always start with trace IDs for complete operation context
- Resource Correlation: Use resource IDs to track specific component behaviors
- Tag-Based Filtering: Leverage tags for quick issue identification
- Temporal Analysis: Use timing information for performance optimization
System Monitoring
- Regular Pattern Review: Monitor for unusual tag combinations
- Resource Tracking: Watch for resource ID anomalies
- Service Health: Ensure consistent service responses
- Alert Response: Immediate attention to alert-tagged entries
Integration Points
The logging system integrates with:
- Rules Engine: Primary service component
- Action Processing: ExecuteAction and ProcessActionSequence functions
- LoRA System: Machine learning model adaptation queuing
- Alert System: Notification and monitoring infrastructure
This documentation provides a comprehensive overview of the OmniWOT logging system structure and usage patterns for development, monitoring, and troubleshooting purposes.
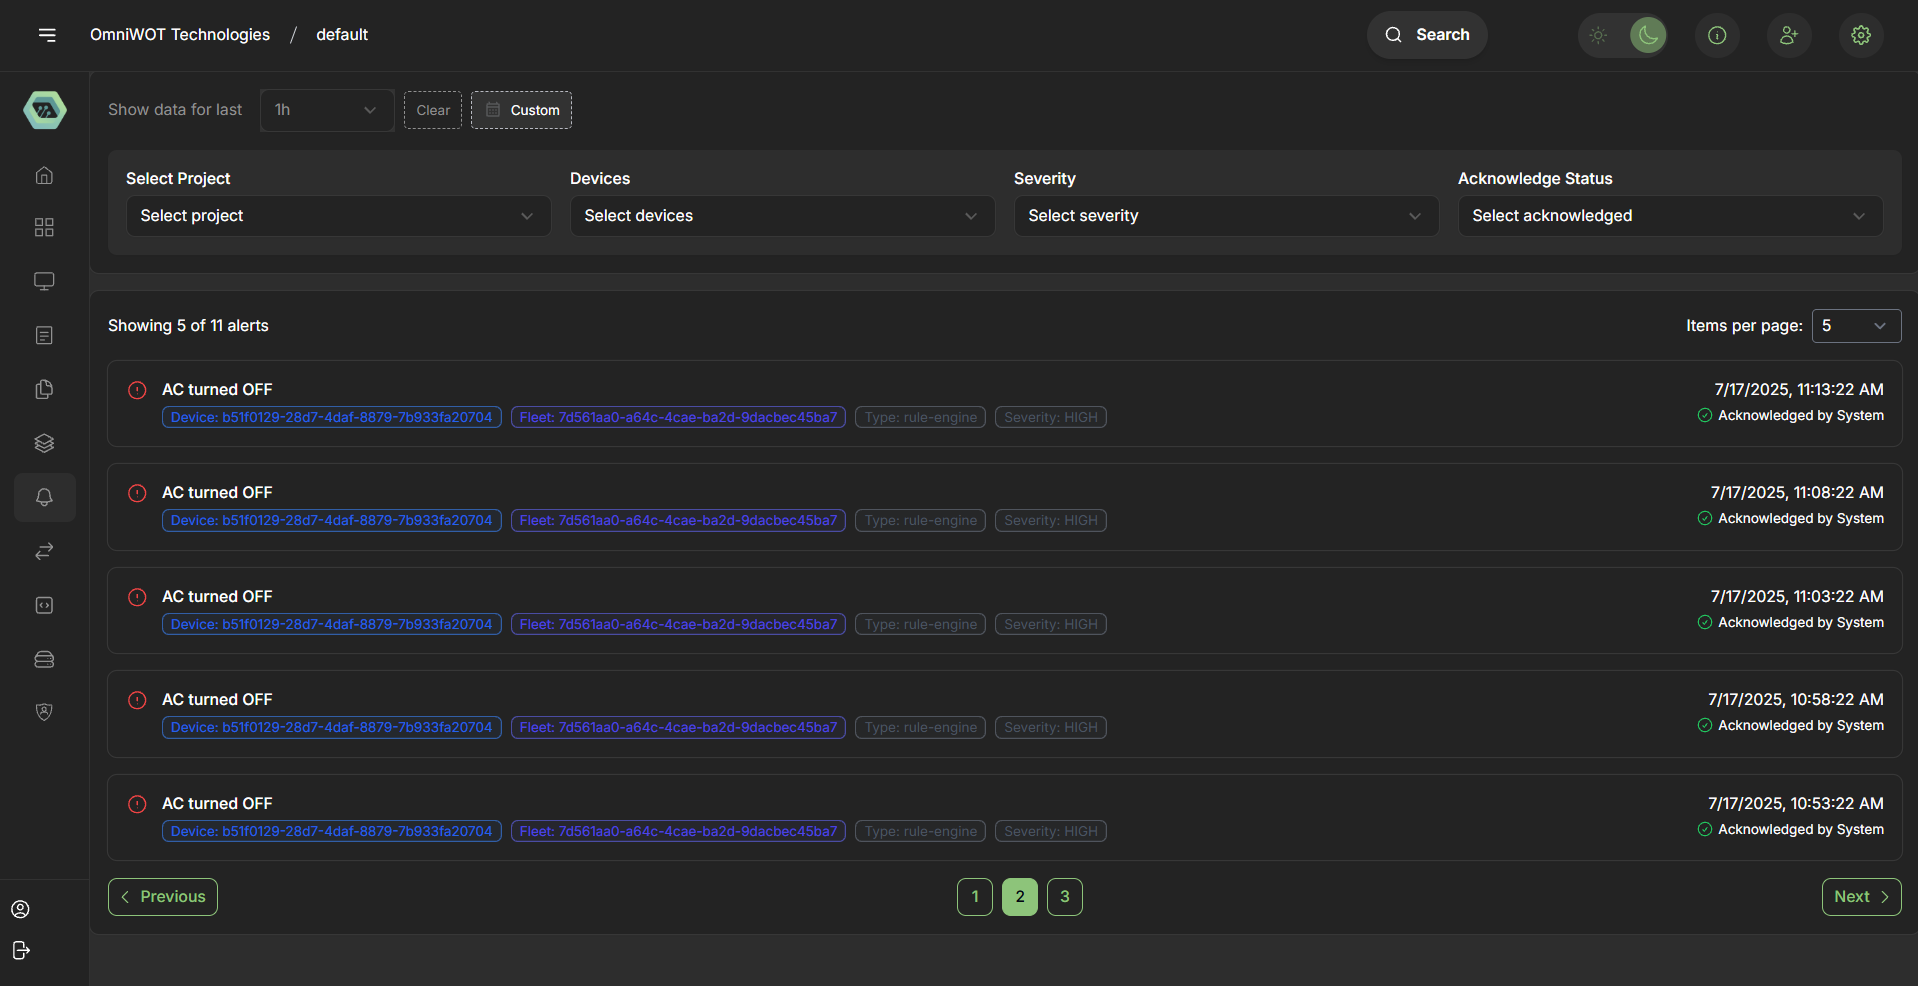
Alerts Overview
The OmniWOT Alerts system provides real-time monitoring and notification capabilities for critical system events. The alerts interface presents a centralized dashboard for tracking, filtering, and managing system alerts with comprehensive metadata and acknowledgment features.
Alert Structure
Alert Information Display
Each alert entry contains the following key components:
Alert Message
- Format: Descriptive text indicating the alert condition
- Example: "AC turned OFF"
- Purpose: Clear, human-readable description of the event or condition
Alert Icon
- Visual Indicator: Red exclamation mark in circle (⚠️)
- Purpose: Immediate visual identification of alert severity
- Consistency: Uniform across all alert entries
Alert Metadata
1. Device Information
- Format: UUID-based device identifier
- Example:
b51f0129-28d7-4daf-8879-7b933fa20704 - Display: Blue pill format for easy identification
- Purpose: Links alert to specific device or component
2. Fleet Information
- Format: UUID-based fleet identifier
- Example:
7d561ad0-a64c-4cae-ba2d-9dacbec45ba7 - Display: Blue pill format matching device styling
- Purpose: Groups devices under fleet management structure
3. Alert Type
- Format: Categorization label
- Example:
rule-engine - Display: Gray pill format
- Purpose: Identifies the system component or rule that triggered the alert
4. Severity Level
- Format: Severity classification
- Example:
HIGH - Display: Gray pill format
- Purpose: Indicates the criticality and urgency of the alert
Temporal Information
Timestamp
- Format: MM/DD/YYYY, HH:MM:SS AM/PM
- Examples:
7/17/2025, 11:43:22 AM7/17/2025, 11:38:22 AM7/17/2025, 11:33:22 AM
- Purpose: Precise timing for alert occurrence tracking
Acknowledgment Status
- Status: "Acknowledged by System"
- Visual Indicator: Green checkmark (✓)
- Purpose: Tracks alert handling and response status
User Interface Features
Filter Controls
Time Range Selection
- Default: "Show data for last 1h"
- Options: Dropdown with time period selections
- Buttons: Clear and Custom options for flexible filtering
Multi-Dimensional Filtering
- Select Project: Project-level filtering
- Select Devices: Device-specific filtering
- Select Severity: Severity-based filtering
- Select Acknowledged: Acknowledgment status filtering
Display Controls
Pagination
- Current View: "Showing 5 of 11 alerts"
- Items per Page: Configurable (default: 5)
- Purpose: Manages large alert volumes efficiently
Search Functionality
- Location: Top navigation bar
- Purpose: Quick alert lookup and filtering
Alert Patterns and Analysis
Common Alert Types
AC System Alerts
- Message Pattern: "AC turned OFF"
- Frequency: Multiple occurrences within short timeframes
- Device Consistency: Same device ID across related alerts
- Severity: HIGH level classification
Timing Patterns
Observable alert sequences:
11:43:22 AM- Most recent alert11:38:22 AM- 5 minutes prior11:33:22 AM- 10 minutes prior11:23:22 AM- 20 minutes prior11:18:22 AM- 25 minutes prior
Alert Metadata Consistency
Device Tracking
- Consistent Device ID:
b51f0129-28d7-4daf-8879-7b933fa20704 - Purpose: All shown alerts relate to the same device
- Implication: Focused monitoring on specific equipment
Fleet Management
- Consistent Fleet ID:
7d561ad0-a64c-4cae-ba2d-9dacbec45ba7 - Purpose: Group-level alert management
- Benefit: Hierarchical organization and response
Rule Engine Integration
- Type:
rule-engine - Consistency: All alerts triggered by rule-based monitoring
- Integration: Links to automated monitoring systems
Alert Management
Acknowledgment System
Automatic Acknowledgment
- Status: "Acknowledged by System"
- Timing: Immediate system response
- Purpose: Automated alert handling and escalation prevention
Manual Acknowledgment Options
- User Interface: Acknowledgment status filtering
- Tracking: Comprehensive acknowledgment history
- Workflow: Support for manual intervention when needed
Alert Lifecycle
1. Alert Generation
- Trigger: Rule engine evaluation
- Metadata: Device, fleet, and severity assignment
- Timestamp: Precise occurrence recording
2. Alert Display
- Interface: Real-time dashboard presentation
- Formatting: Consistent visual styling
- Filtering: Multi-dimensional search capabilities
3. Alert Acknowledgment
- Process: System or manual acknowledgment
- Tracking: Status update and history maintenance
- Resolution: Alert lifecycle completion
Integration Points
System Components
- Rule Engine: Primary alert generation mechanism
- Device Management: Device and fleet identification
- Monitoring System: Real-time alert processing
- Notification System: Alert distribution and acknowledgment
Data Flow
- Monitoring: Continuous system state evaluation
- Rule Processing: Condition-based alert triggering
- Alert Generation: Metadata enrichment and formatting
- Dashboard Display: Real-time alert presentation
- Acknowledgment: Response tracking and management
Monitoring and Troubleshooting
Key Indicators
- Alert Frequency: Monitor for unusual alert patterns
- Acknowledgment Status: Track response times and coverage
- Device Consistency: Identify problematic devices or fleets
- Severity Distribution: Balance system responsiveness
Performance Metrics
- Alert Volume: Track total alerts over time periods
- Response Time: Monitor acknowledgment latency
- Resolution Rate: Measure alert lifecycle completion
- False Positive Rate: Evaluate rule engine accuracy
Best Practices
Alert Response
- Immediate Assessment: Review HIGH severity alerts promptly
- Pattern Recognition: Identify recurring alert conditions
- Root Cause Analysis: Investigate device-specific issues
- Escalation Procedures: Define response protocols
System Optimization
- Filter Utilization: Leverage filtering for focused monitoring
- Historical Analysis: Review alert patterns over time
- Rule Tuning: Optimize rule engine configurations
- Acknowledgment Discipline: Maintain proper alert lifecycle management
This comprehensive alerts documentation provides operational guidance for monitoring, managing, and responding to OmniWOT system alerts effectively.
This documentation provides a comprehensive overview of the OmniWOT logging system structure and usage patterns for development, monitoring, and troubleshooting purposes.