Dashboard
Table of Contents
- Introduction
- Dashboard Overview
- Accessing Your Dashboard
- Creating Dashboard Panels
- Panel Types and Visualizations
- Managing Your Dashboard
- Pro Tips
- Related Features
Introduction
Create powerful, real-time dashboards in minutes—no technical complexity required. Easily monitor device health, performance metrics, and data from protocols like LoRaWAN, BLE, UWB, BACnet, Modbus, and more. With quick onboarding and intuitive tools, turn connected data into actionable insights effortlessly.
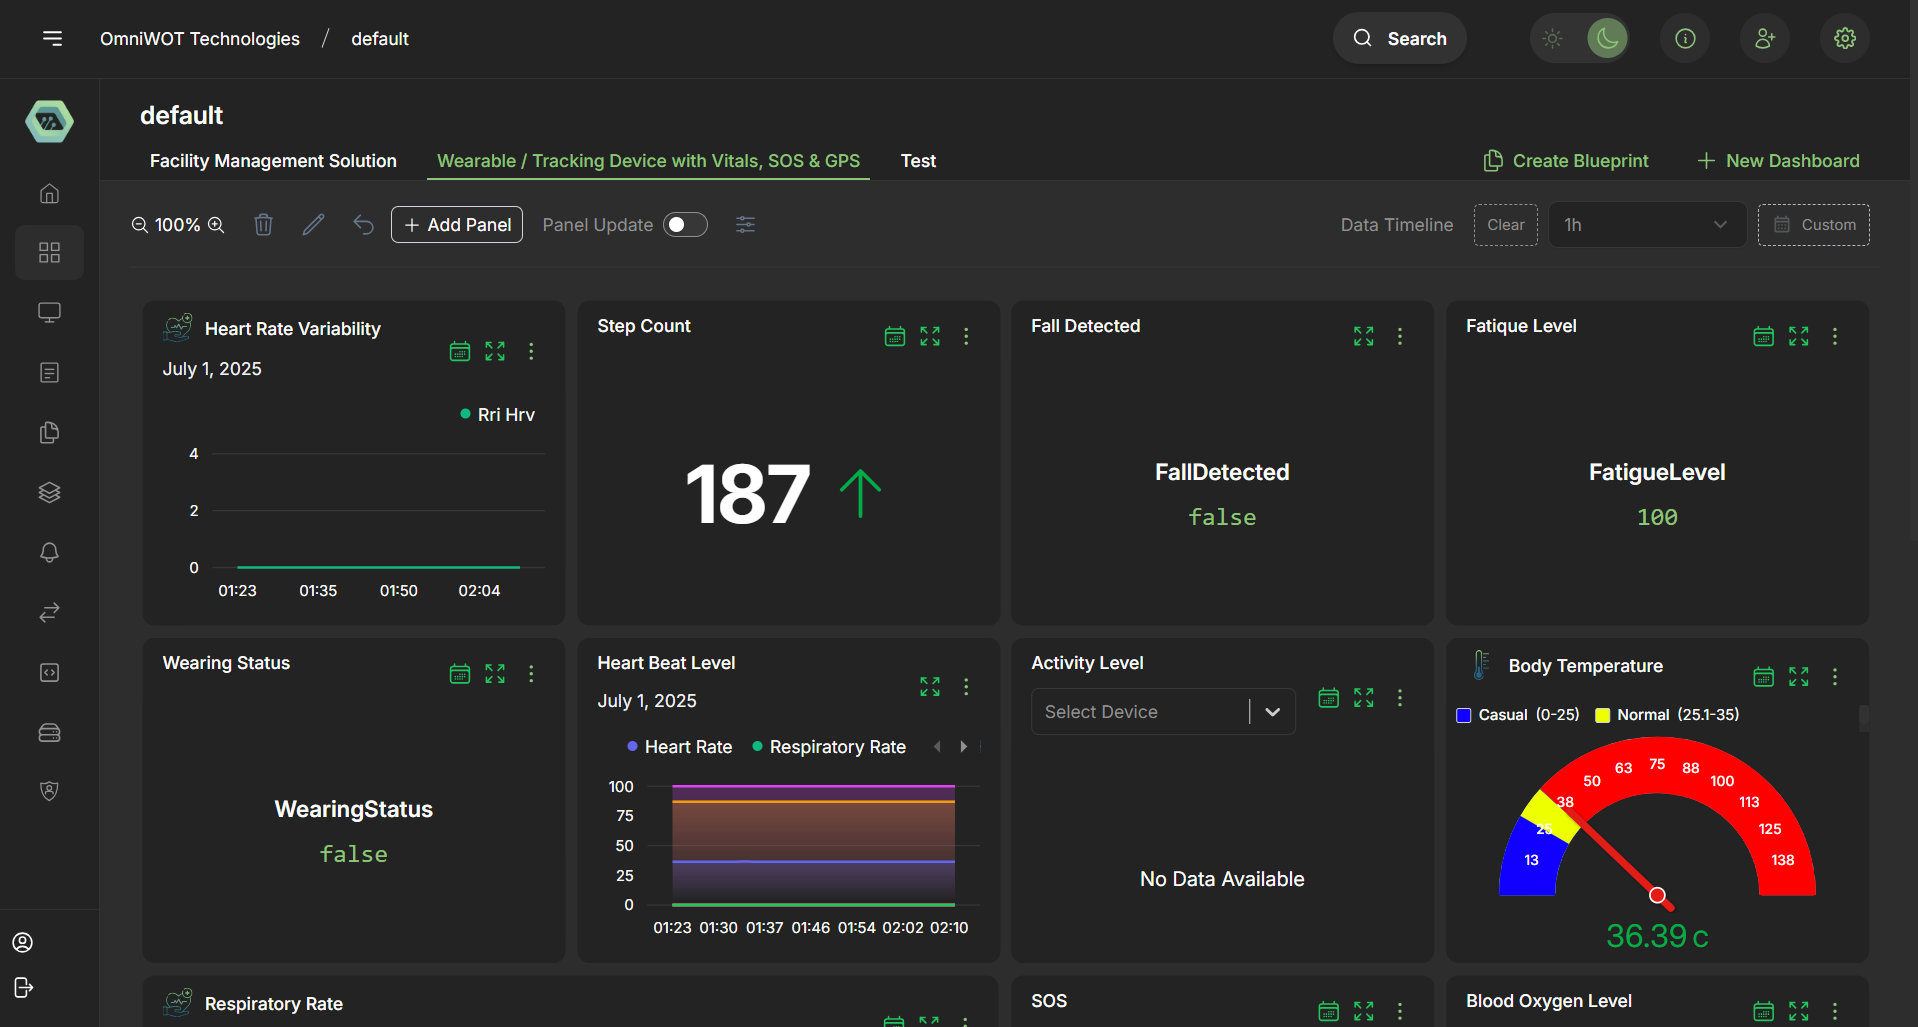
Dashboard Overview
Create powerful dashboards with real-time data visualization. Monitor device health, track performance metrics, and gain actionable insights from your connected devices.
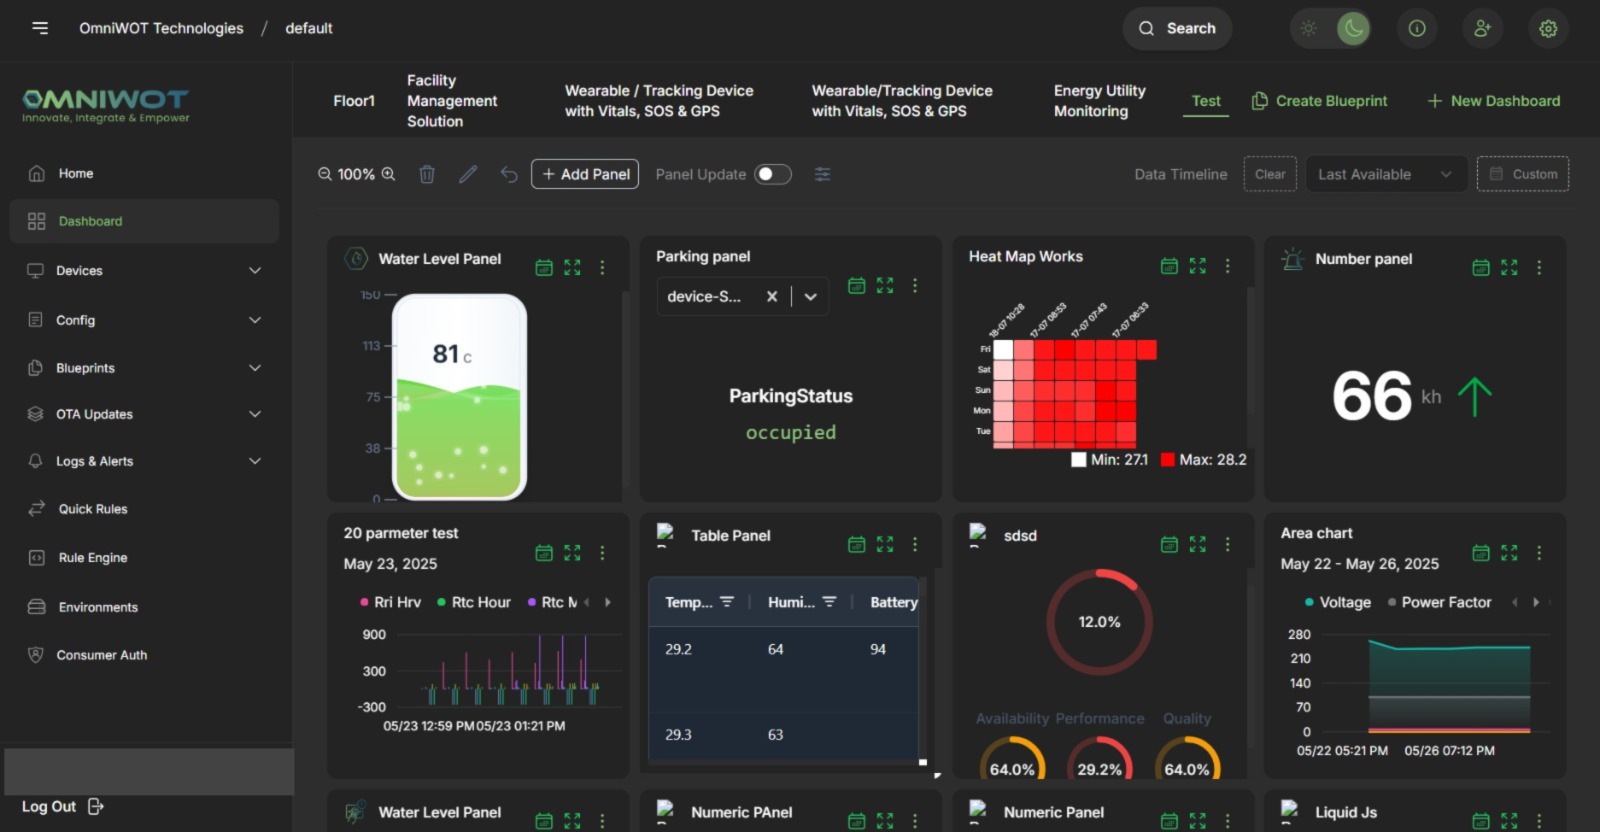
Key Features:
- Real-time Data Visualization - View live data from your IoT devices
- Multiple Chart Types - Choose from various visualization options
- Customizable Panels - Configure panels to display specific metrics
- Device Health Monitoring - Track battery levels, signal strength, and more
- Performance Analytics - Analyze trends and patterns in your data
Creating Dashboard Panels
Follow these step-by-step instructions to add new panels to your dashboard:
Step 1: Add Panel
- Navigate to your dashboard
- Click the "Add Panel" button from the top toolbar

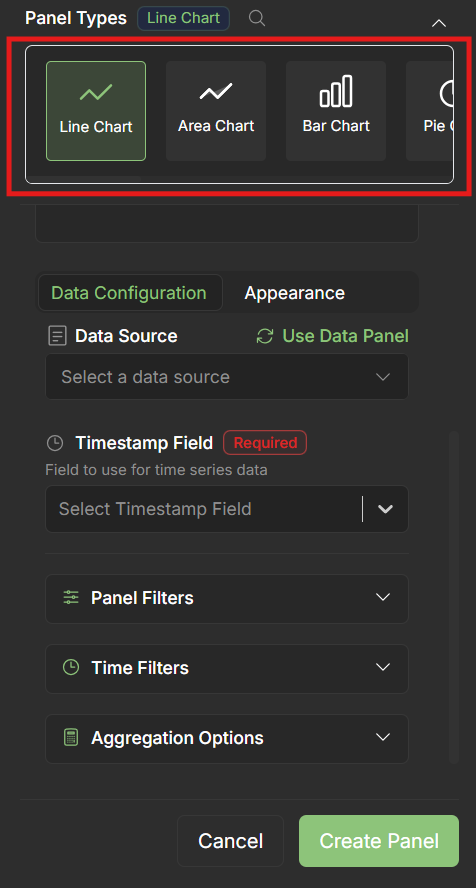
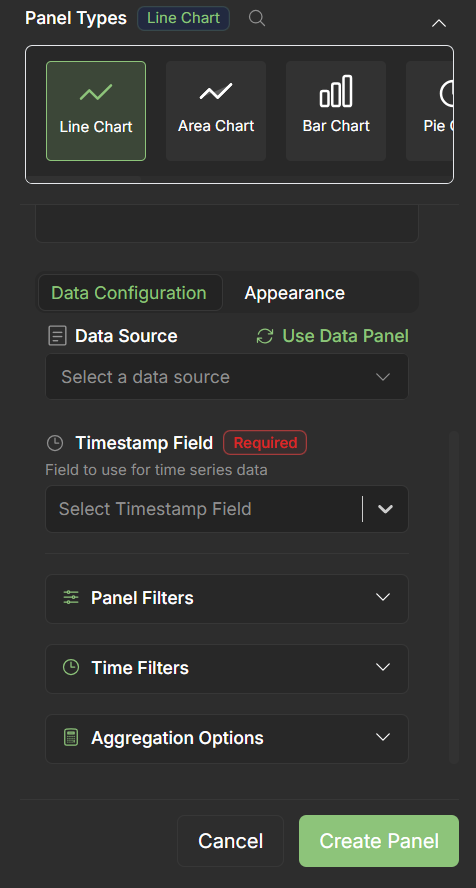
Step 2: Select Panel Type
Choose the Panel Type from the available options
Select the type of graph or visualization you want to use for your data
Common panel types include:
Line Charts
Bar Charts
Gauge Charts
Table Views
Status Indicators
Step 3: Configure Panel
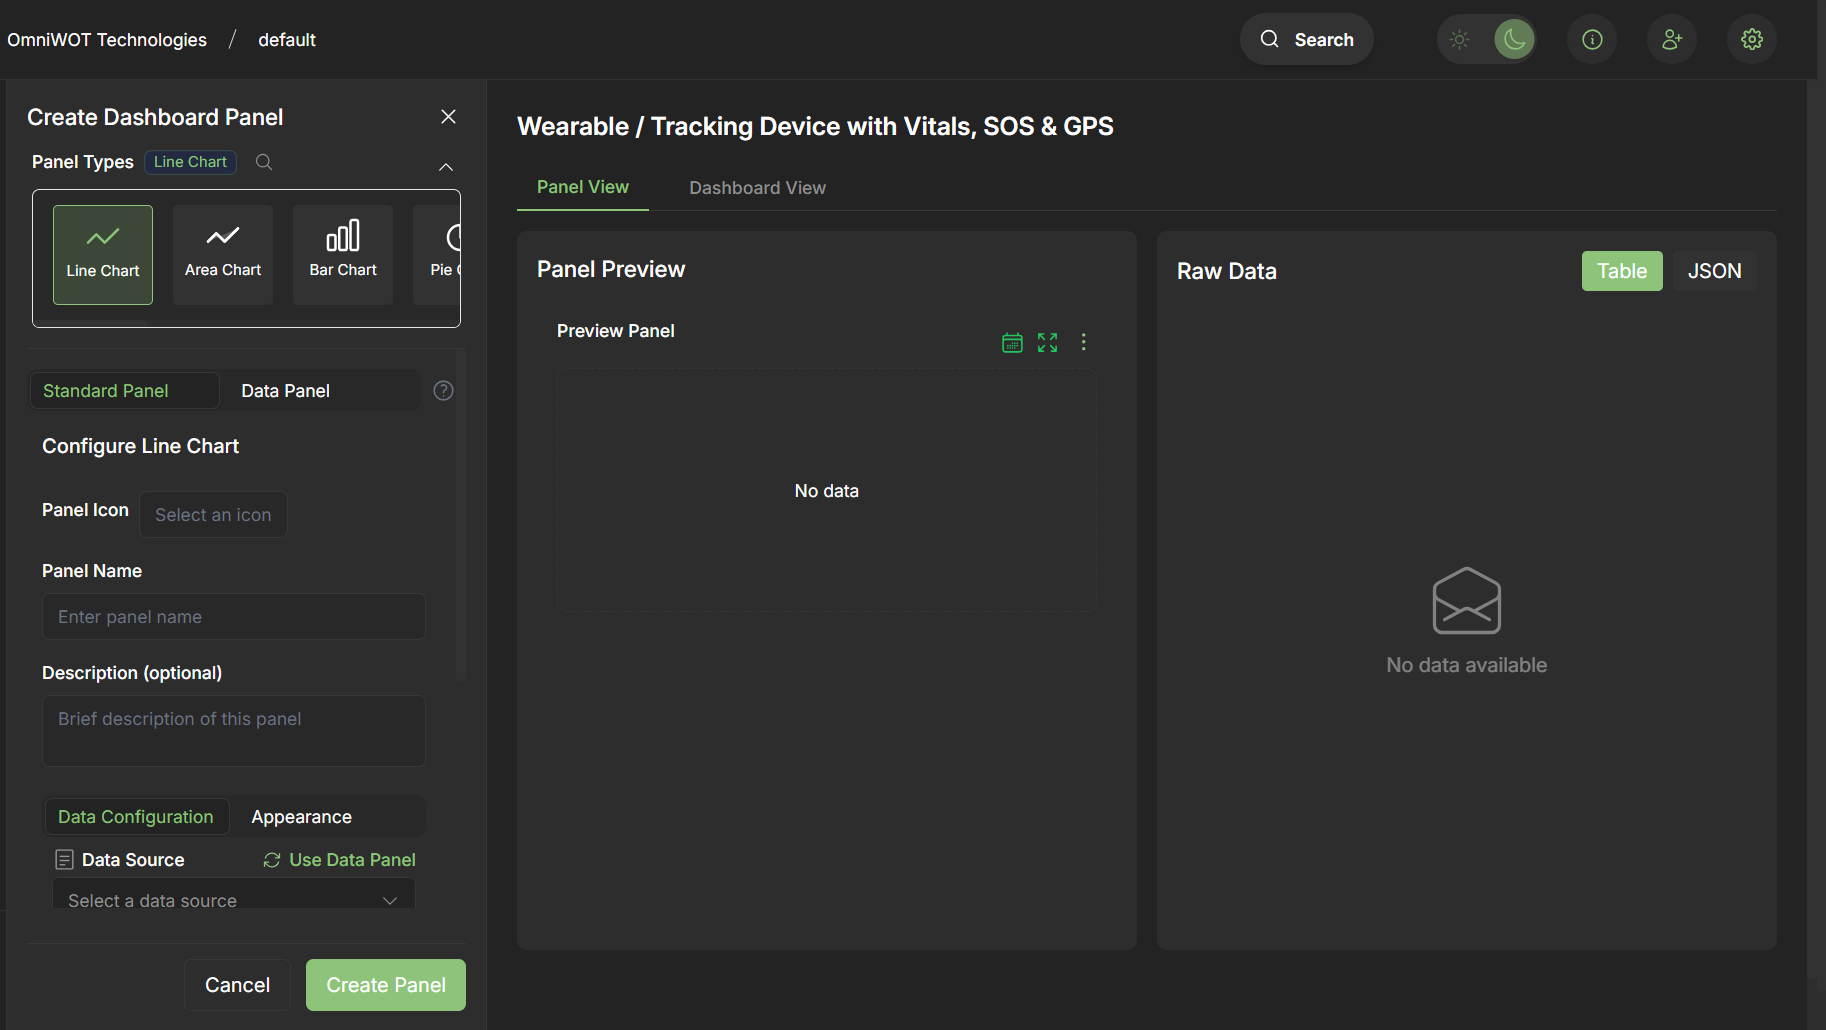
- Select a Panel Icon that represents your data
- Choose from available icons
- The icon will help identify your panel at a glance
Step 4: Panel Information
- Fill in the Panel Name - choose a descriptive name for your panel
- Add a Panel Description - provide context about what the panel displays
- This information helps other users understand the panel's purpose
Step 6: Data Configuration
- Select Data Source - choose the device or device group to monitor
- Select Data Parameters - choose specific metrics such as:
- Battery level
- Humidity readings
- Temperature data
- Signal strength
- Custom sensor readings
- Configure Timestamp Field - select the appropriate timestamp field for your data
- Set up any additional data filters or transformations
Step 7: Create Panel
- Review all your panel configurations
- Click the "Create Panel" button
- Your panel will be added to the dashboard and begin displaying real-time data
✅ Success! You have successfully created your panel and can now visualize data in real-time on your dashboard.
Panel Types and Visualizations
Line Charts
- Best for: Time-series data, trends, and continuous measurements
- Use cases: Temperature over time, battery level trends, signal strength monitoring
Bar Charts
- Best for: Comparing discrete values, categorical data
- Use cases: Device counts, error rates, performance comparisons
Gauge Charts
- Best for: Current values with defined ranges
- Use cases: Battery levels, humidity percentages, temperature readings
Table Views
- Best for: Detailed data with multiple columns
- Use cases: Device status tables, configuration overviews
Status Indicators
- Best for: Binary states and alerts
- Use cases: Device online/offline status, alert conditions
Managing Your Dashboard
Panel Management
- Resize Panels - Drag panel corners to resize
- Move Panels - Click and drag panels to reposition
- Edit Panels - Click the edit icon to modify panel settings
- Delete Panels - Remove panels you no longer need
Dashboard Settings
- Auto-refresh - Set automatic refresh intervals
- Time Range - Configure default time ranges for panels
- Layout - Save and restore dashboard layouts
Pro Tips
Optimizing Dashboard Performance
- Limit the number of panels per dashboard for better performance
- Use appropriate time ranges to avoid overwhelming data loads
- Consider using data aggregation for long time periods
Best Practices for Panel Creation
- Use descriptive panel names and descriptions
- Choose appropriate chart types for your data
- Group related metrics in nearby panels
- Use consistent color schemes across panels
Data Source Selection
- Select specific devices for detailed monitoring
- Use device groups for fleet-wide overviews
- Consider data retention policies when configuring time ranges