E Maps
What is E Maps
An E-Map in IoT is a digital floor plan visualization system where users can upload building layouts and place IoT devices on them. Each device is represented visually on the map and displays its real-time parameters (e.g., temperature, humidity, energy usage). This transforms raw IoT data into an interactive, location-aware monitoring dashboard
🔹 Use Cases
Smart Buildings
- Place temperature, humidity, and air quality sensors on each floor plan.
- Monitor HVAC systems and detect hot/cold zones in real time.
Factories & Industrial Plants
- Track machines and equipment on a digital plant layout.
- Show vibration, power consumption, or maintenance status.
Hospitals & Healthcare Facilities
- Visualize patient monitoring devices across wards.
- Highlight emergency alarms (oxygen supply, ICU temperature).
Data Centers
- Map server racks with IoT sensors for heat and energy usage.
- Quickly detect overheating or power failure spots.
Retail & Malls
- Show footfall counters, lighting sensors, and energy monitoring devices.
- Optimize facility management.
🔧 How E Map works
Configuring an E-Map involves the following steps:
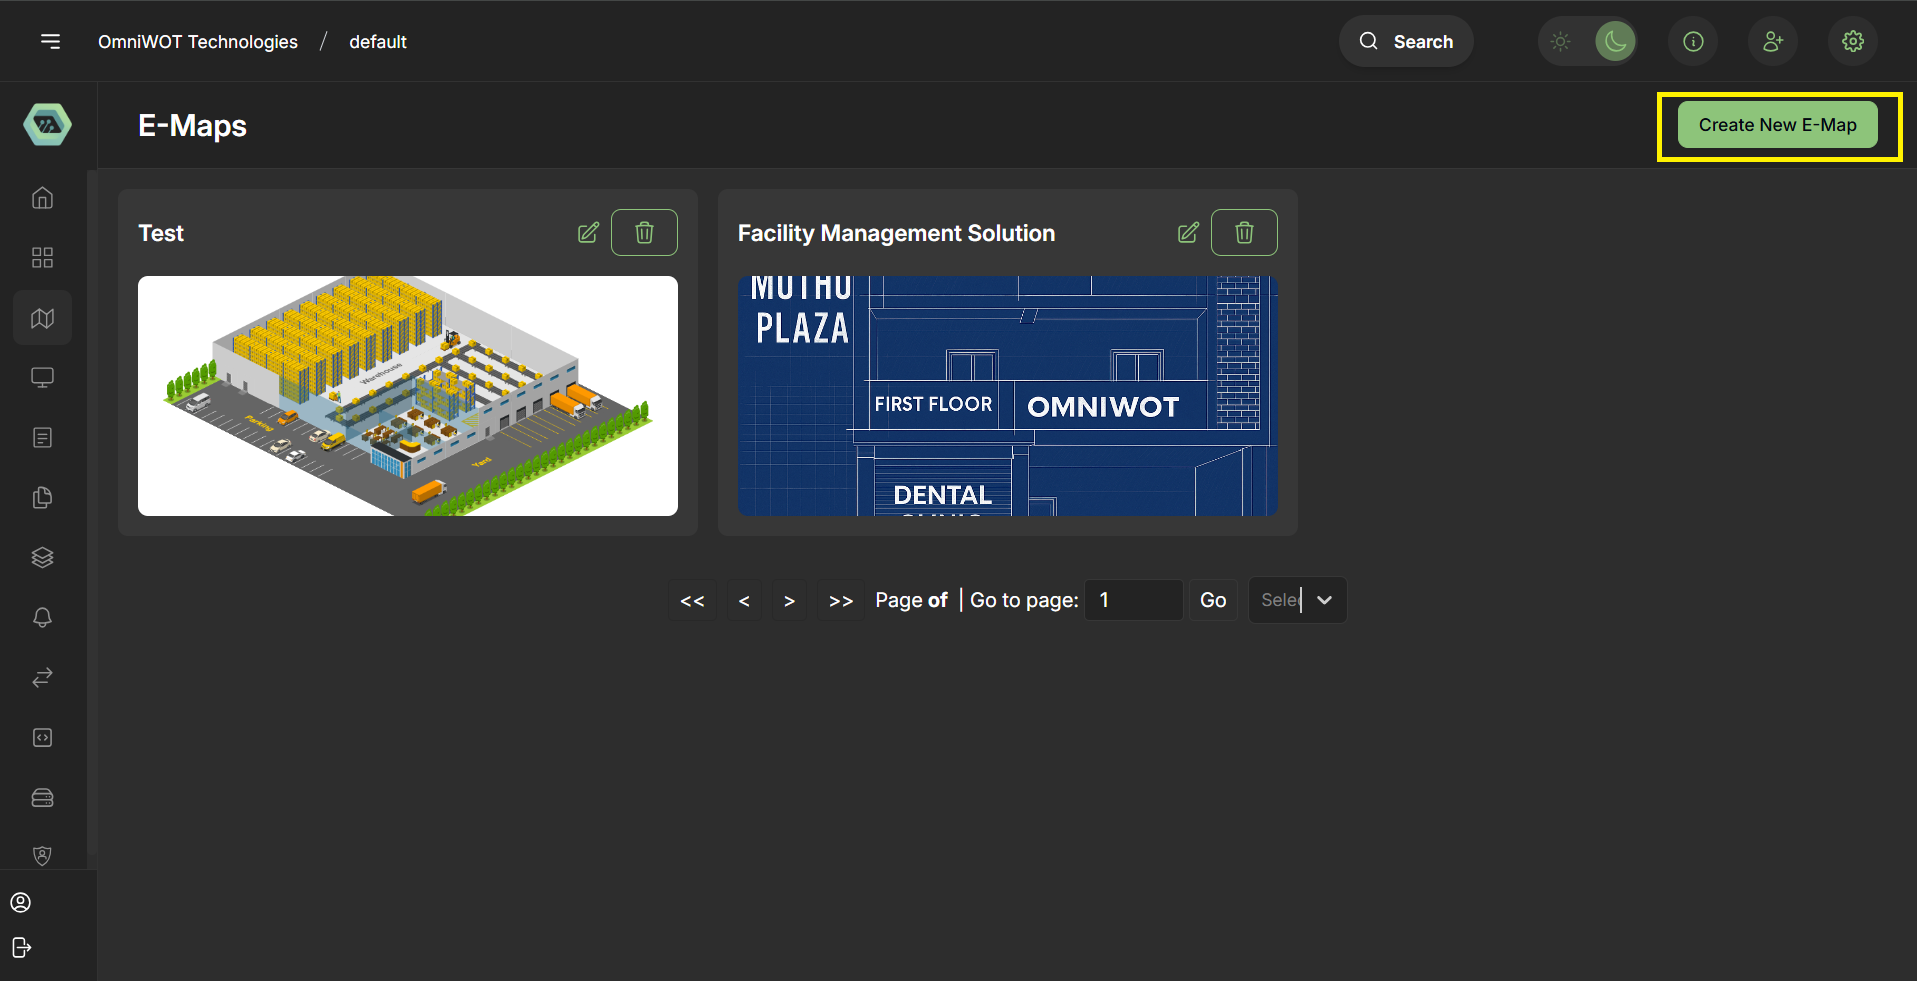
Step 1: Click on "create a new E-Map" button.
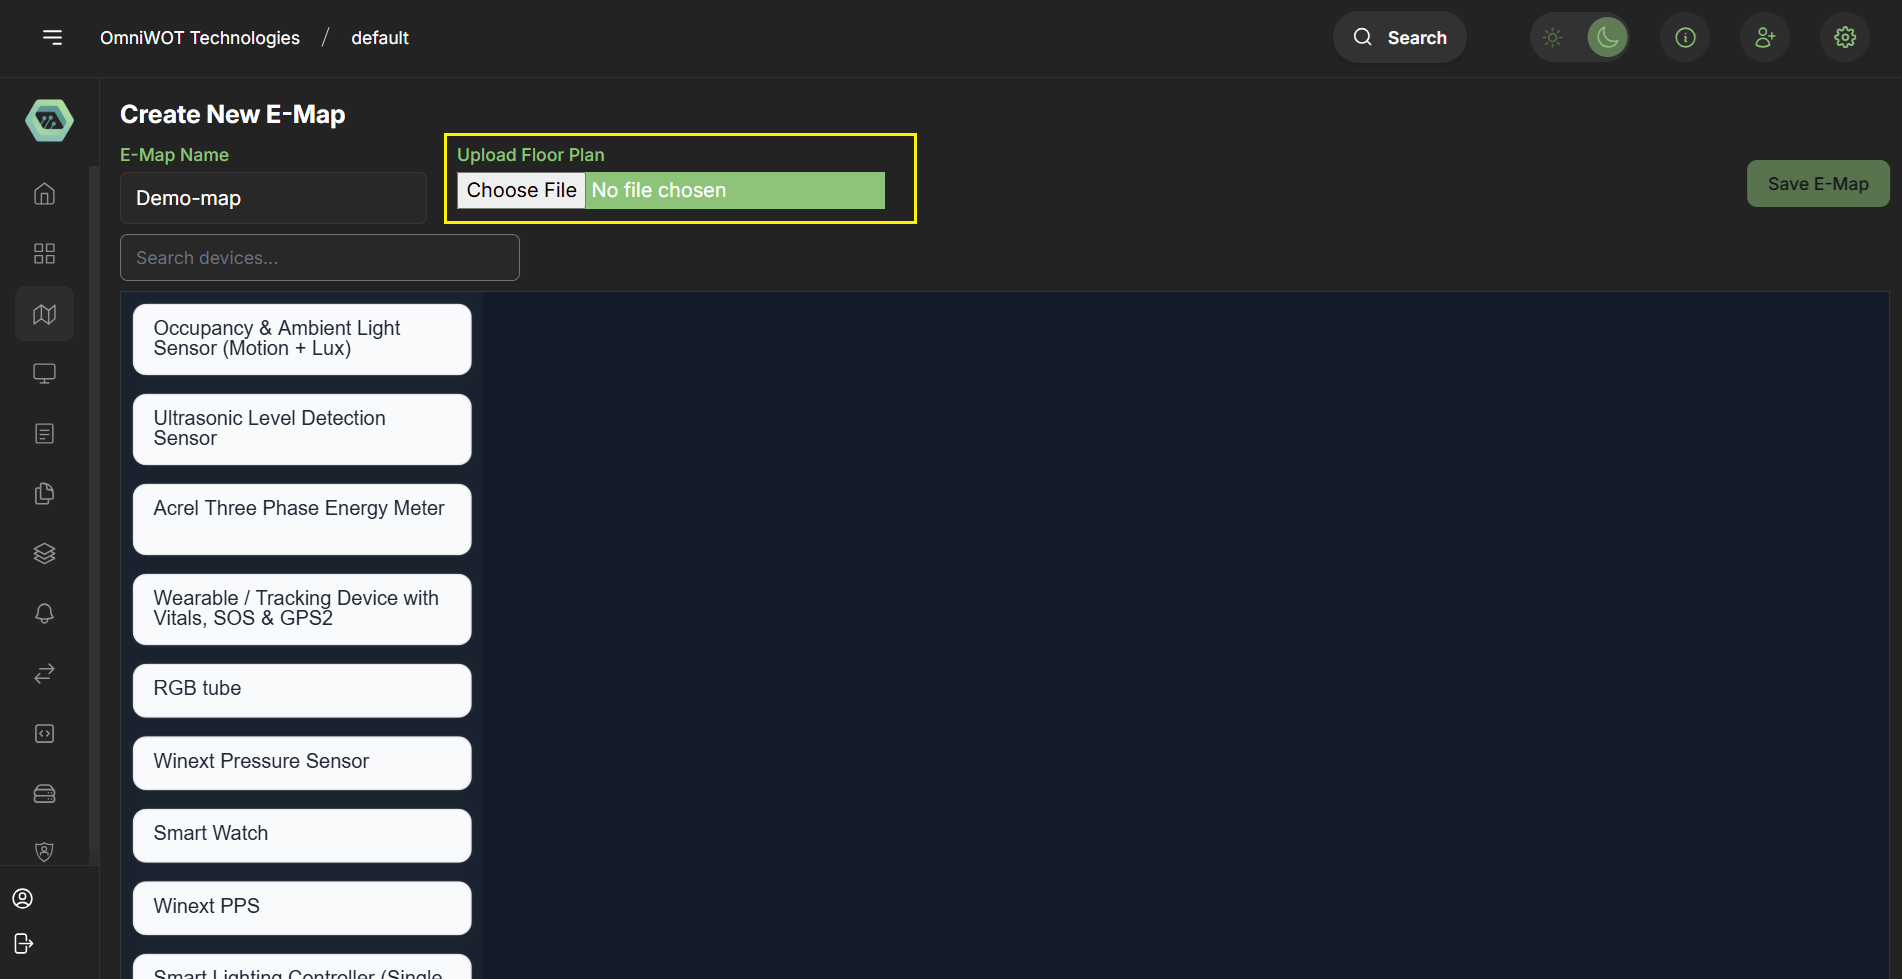
Step 2: Basic Information
- Name: Descriptive title (e.g., "High Temp Alert")
- Floor Plan: click on choose file to upload the floor plan image
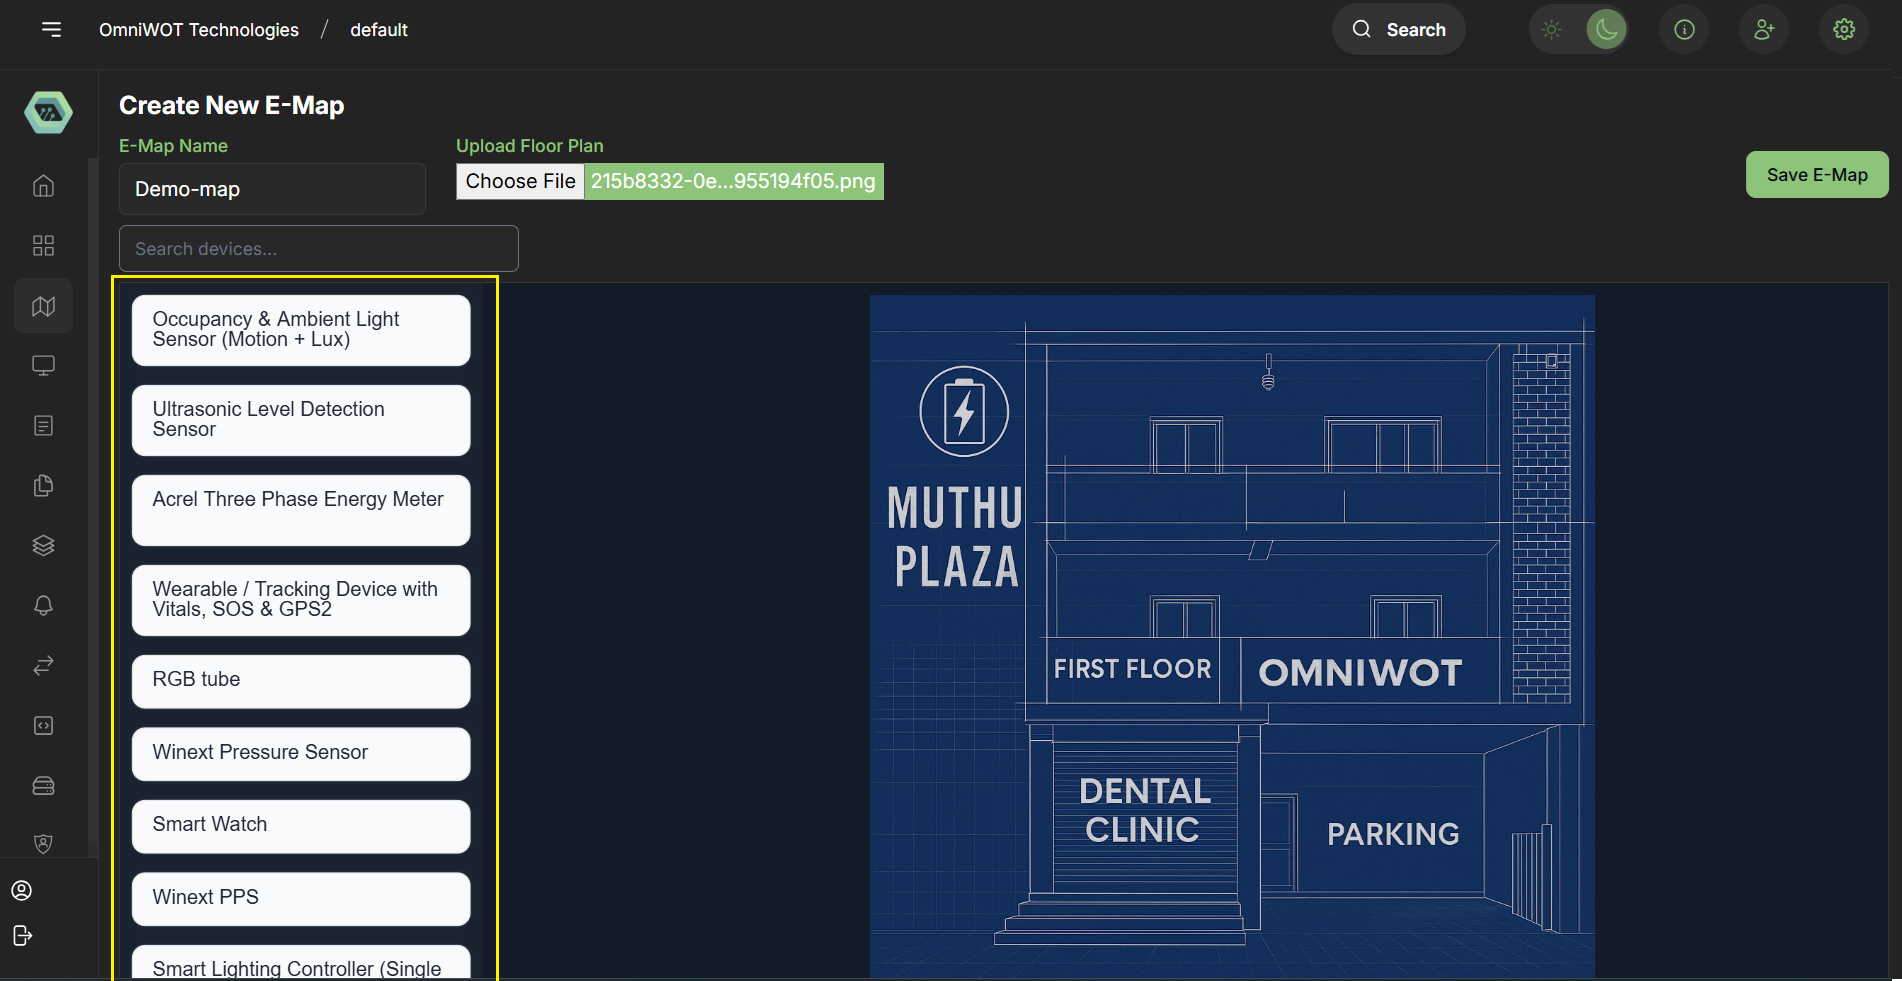
Step 3: Add Devices
- you can on left side we have a list of devices and you can add them to the map by dragging and dropping them on the map
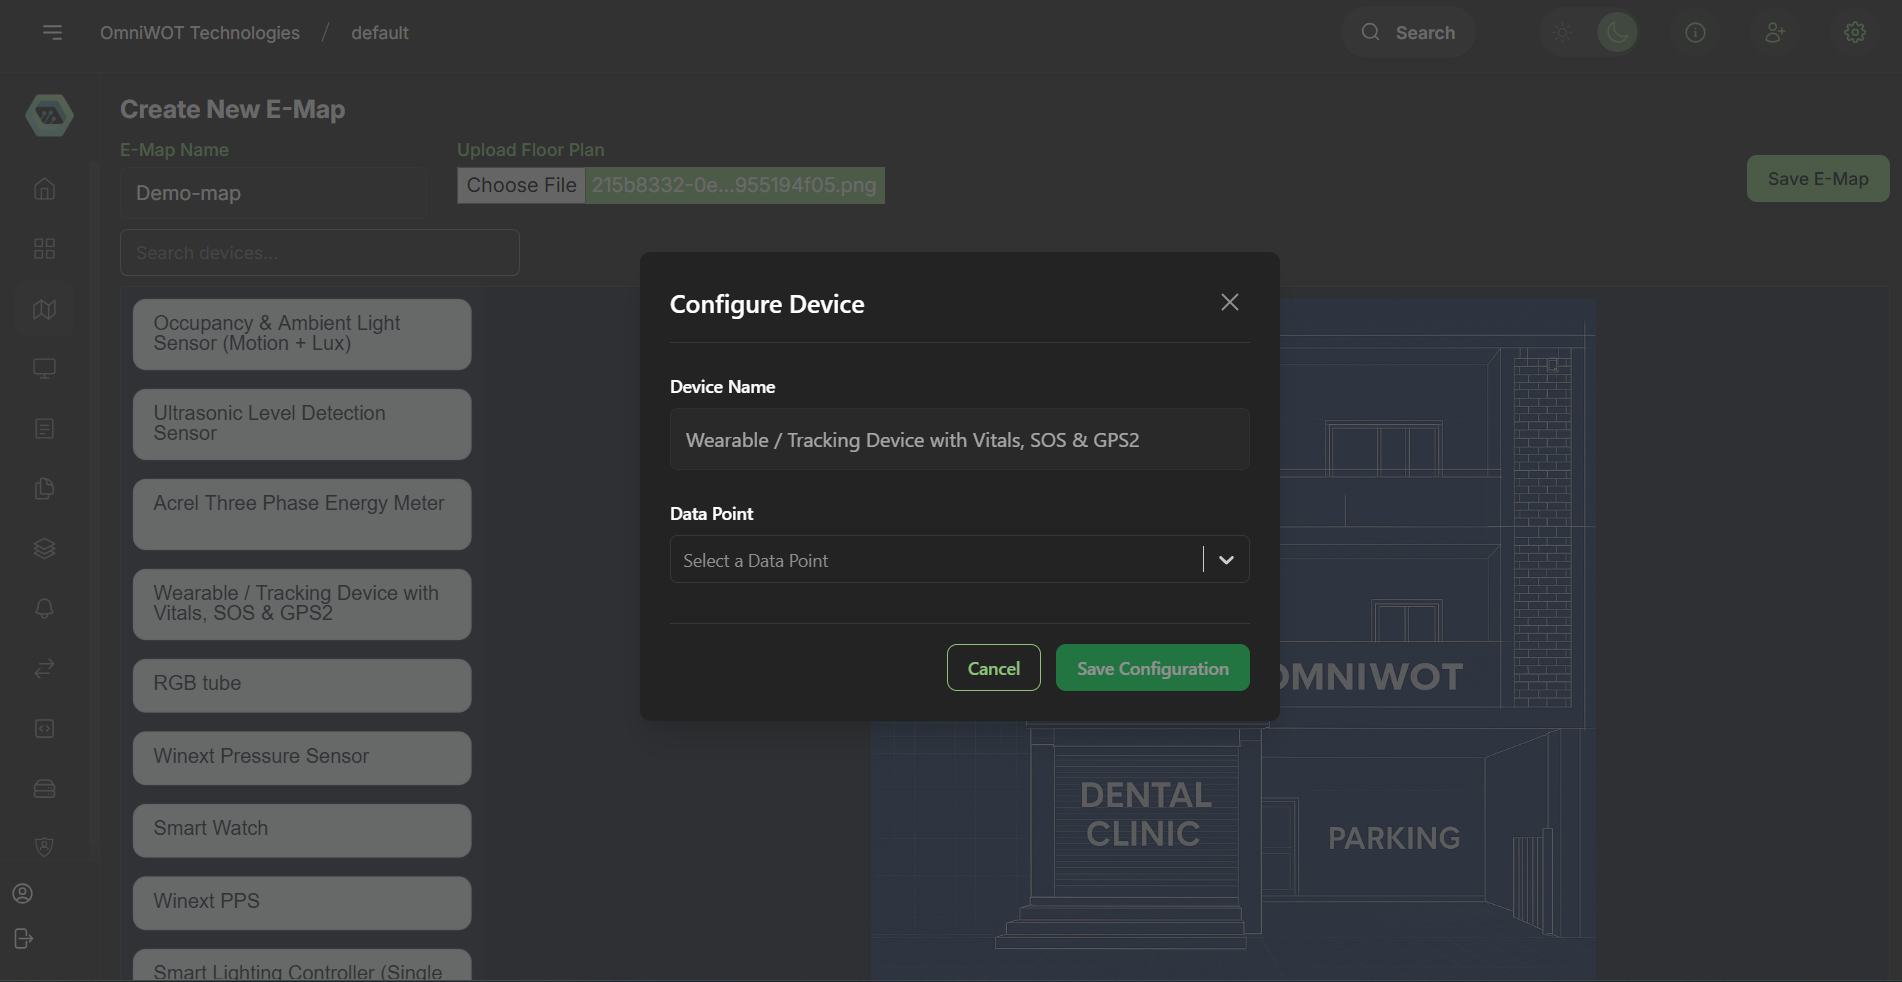
Step 4: Configure Devices
- After dropping the device on the map, you can see the modal to configure the device
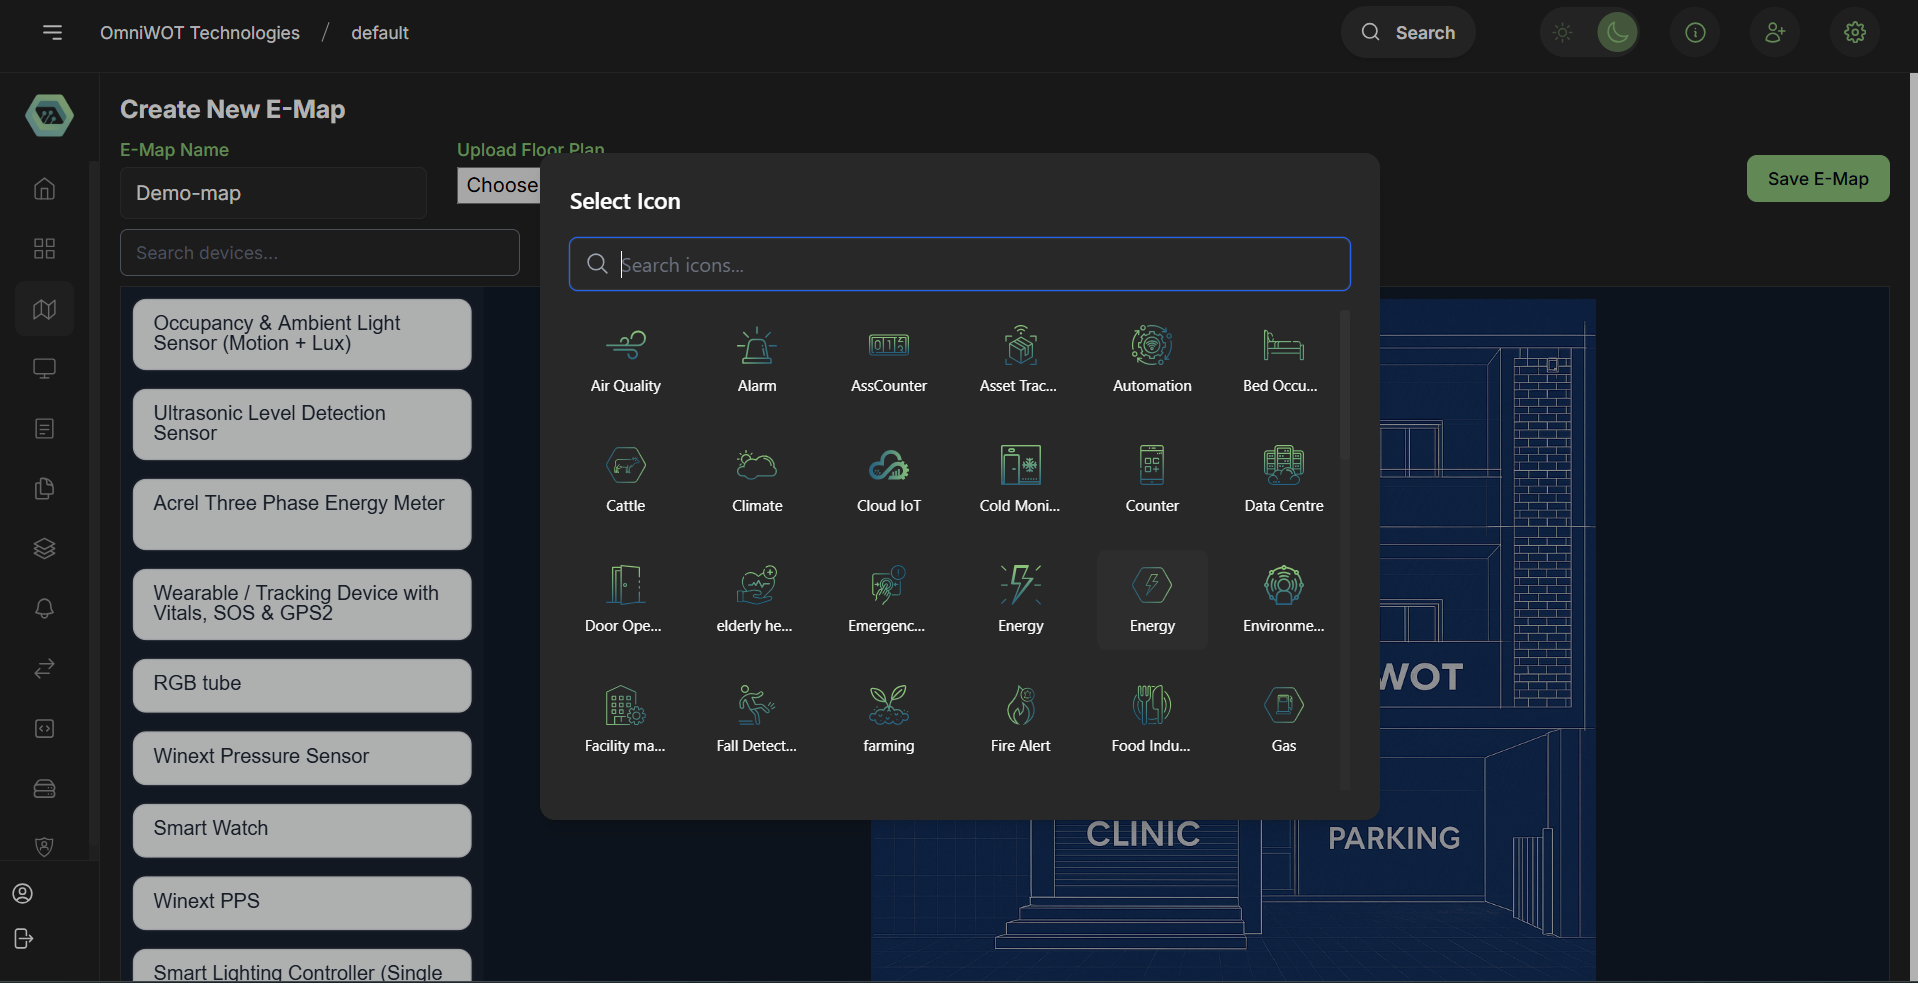
- select the device icon
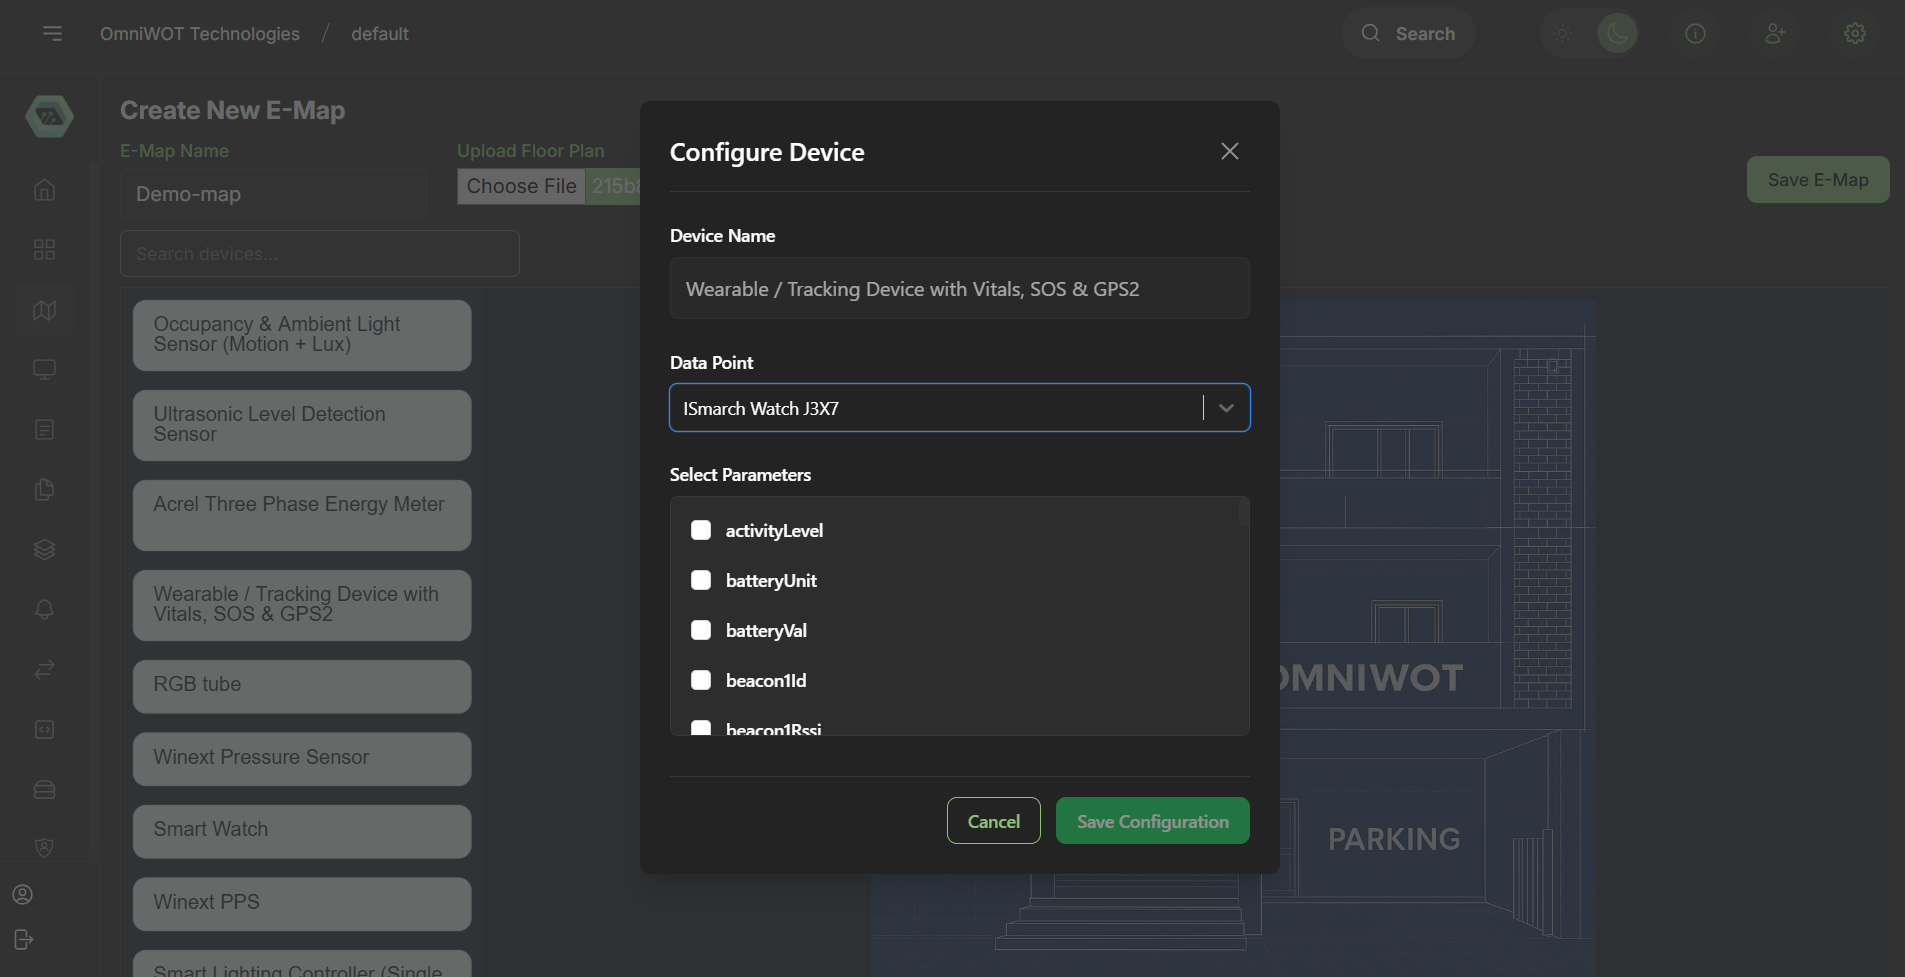
- select data point
- select the data point parameters
Step 5: set devices position on map
- you can set the devices position on the map by dragging and dropping them on the map
- you can also have option to update device configuration and remove the device from the map

Step 6: save the e-map
- you can save the e-map by clicking on the save button

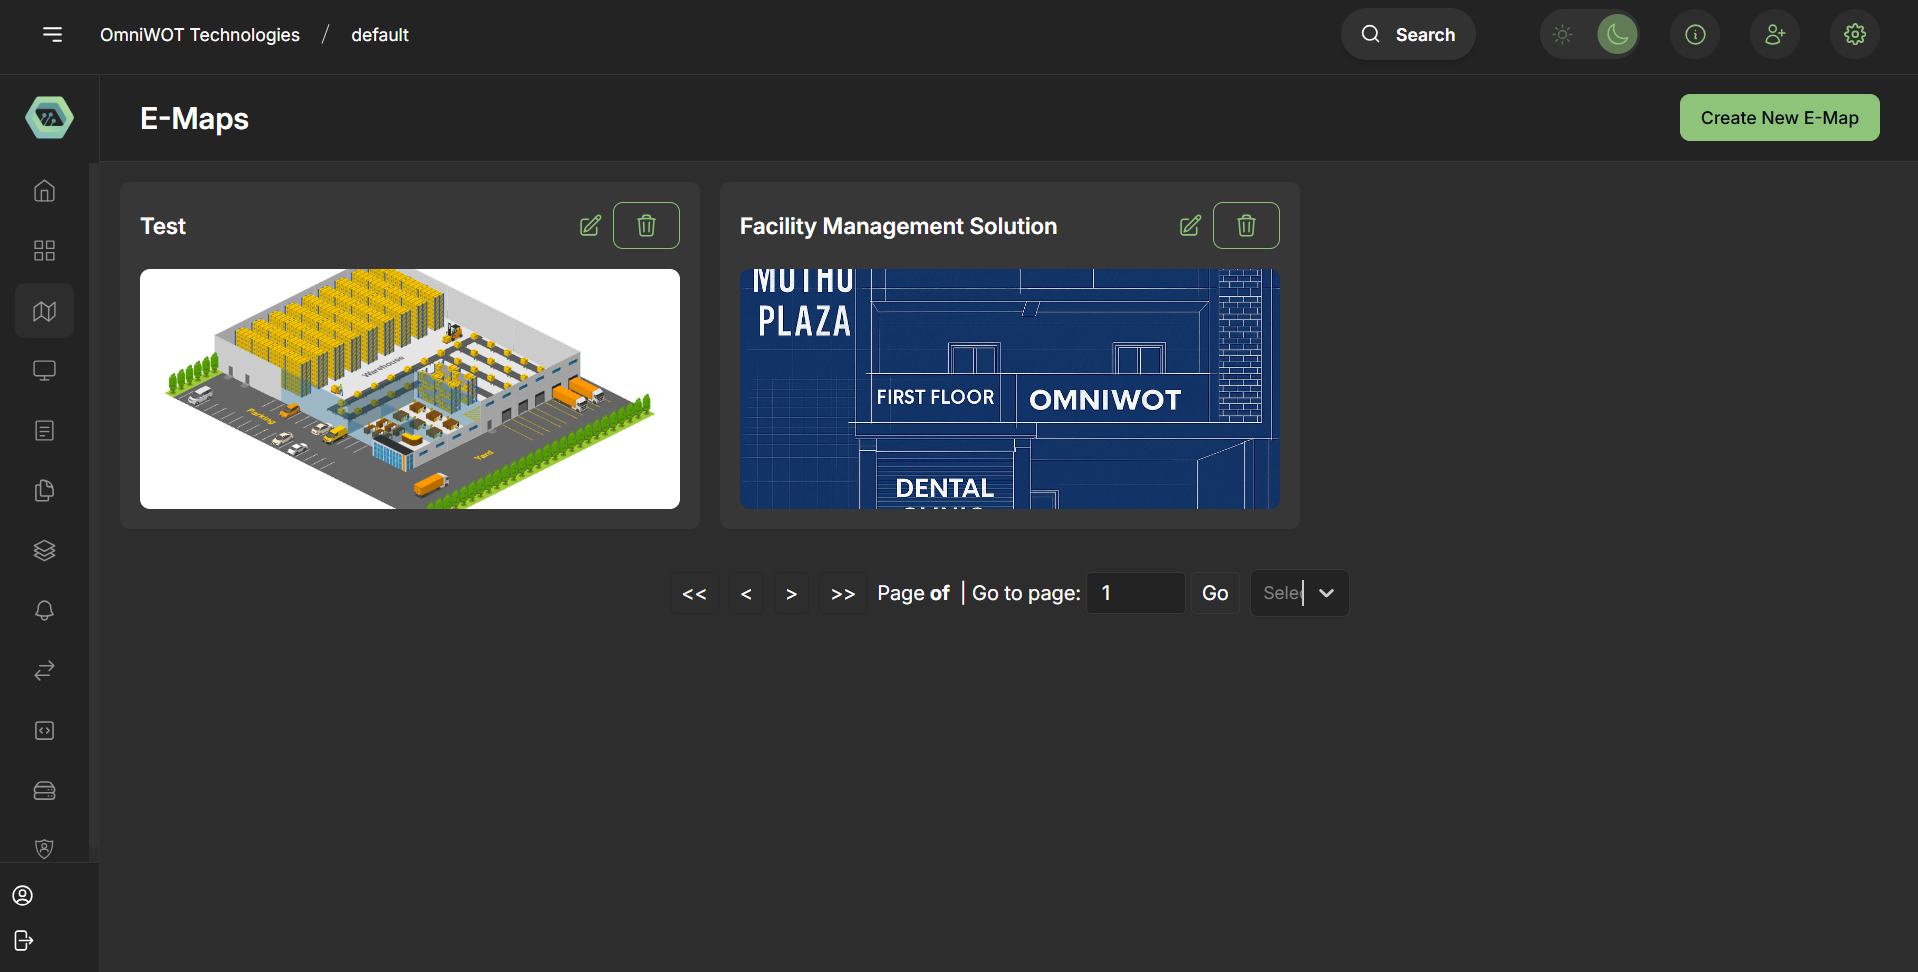
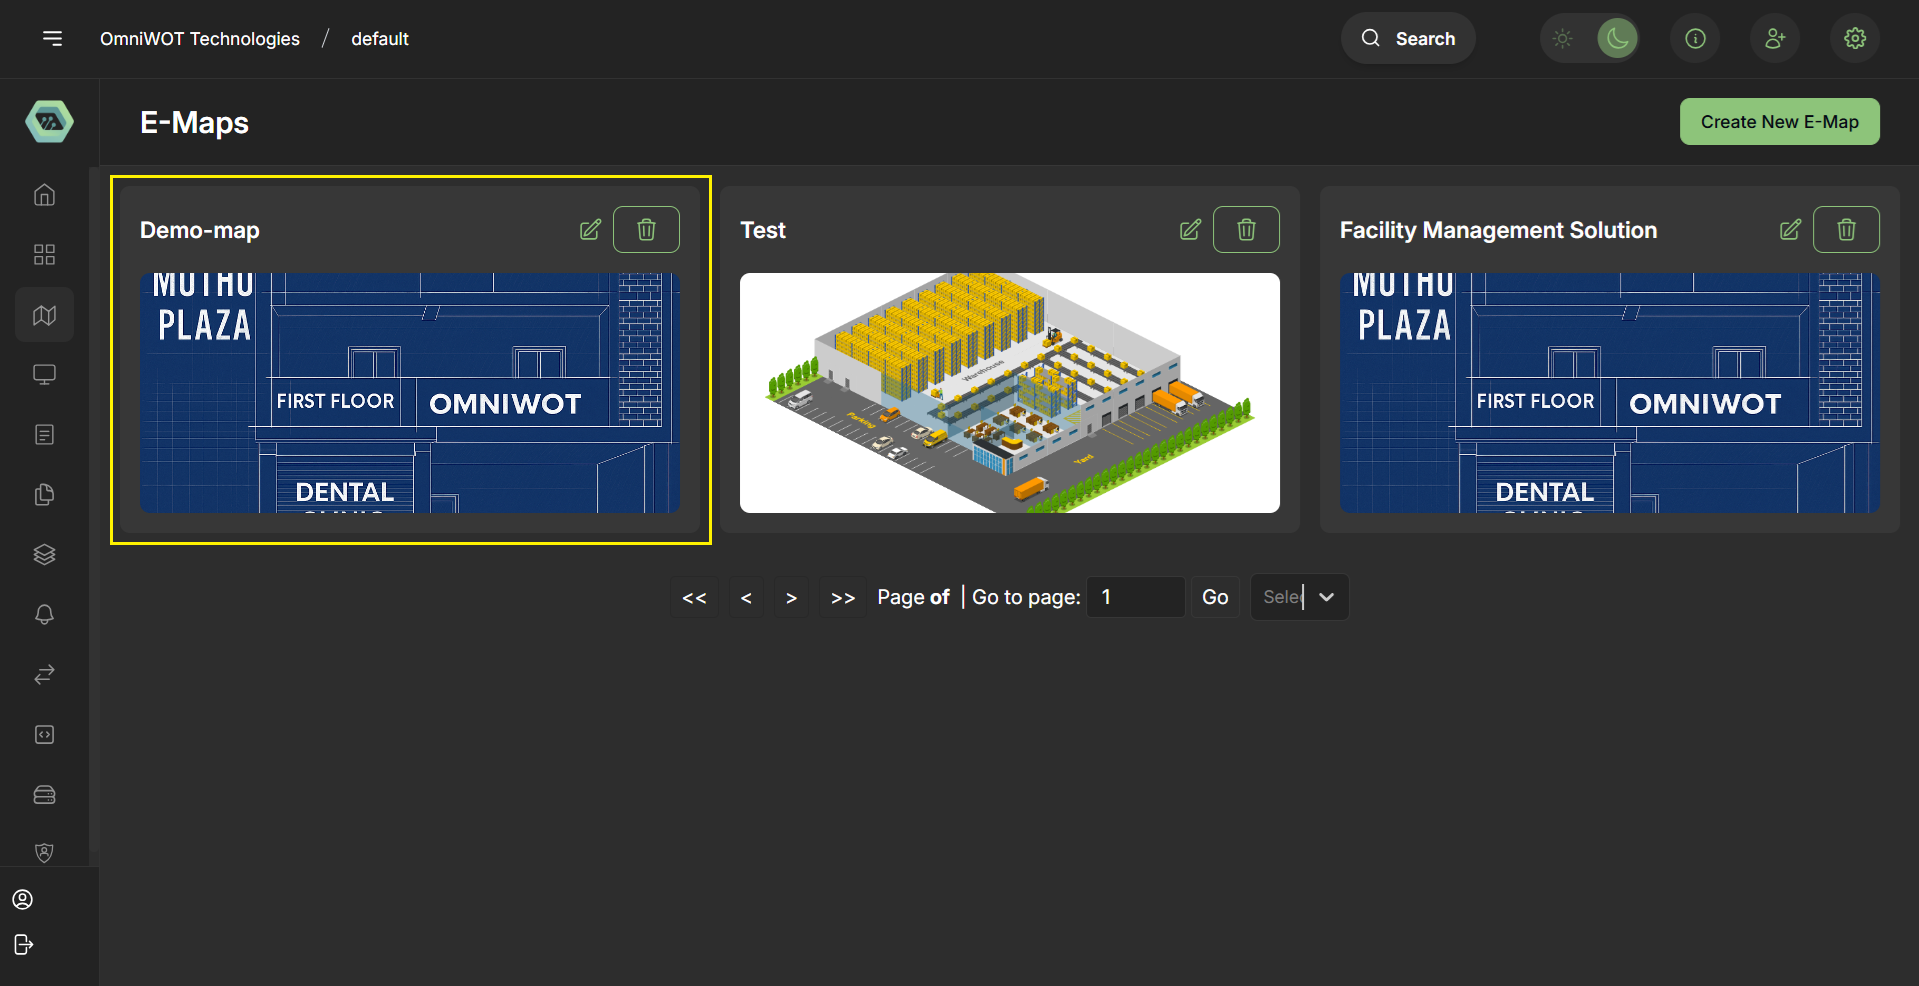
Step 7: view the e-map
- you can see the e-map is added to the list of e-maps and you can view it by clicking on the e-map
- you can also edit the e-map by clicking on the edit button icon and remove the e-map by clicking on the delete button icon
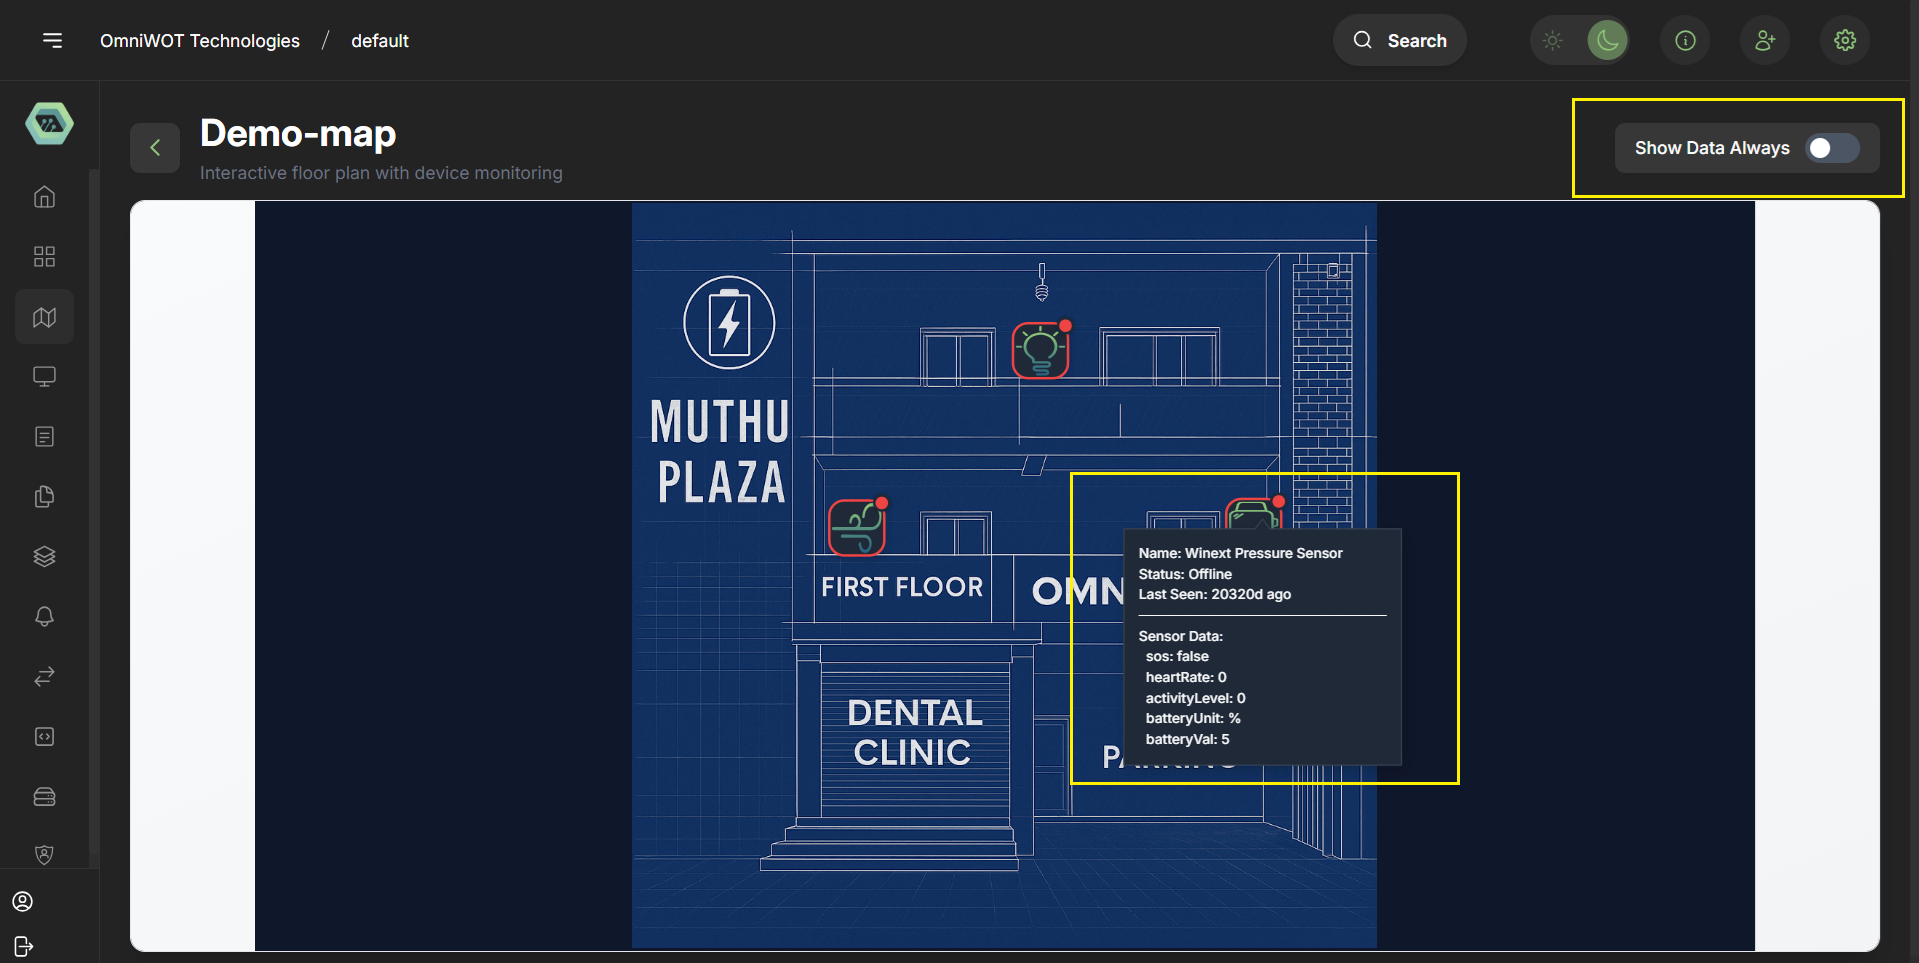
- After clicking on the e-map you can see the e-map with the devices
- On Hover on the device icon you can able to see device data with the help of tooltip
- You also have option show data always by clicking on the show data always on the map
🚀 Benefits of E-Maps
✅ Visual Device Management – Operators see where each sensor/device is located.
✅ Real-Time Awareness – Parameters like temperature or status update live on the map.
✅ Quick Fault Detection – Faulty or abnormal devices are highlighted instantly.
✅ User-Friendly – Easy for both technical and non-technical staff to monitor.
✅ Scalability – Works for single-floor, multi-floor, or large facilities.
✅ Improved Decision Making – Location-aware data helps optimize operations (e.g., where cooling is needed most).
📌 Summary
E-Maps are a powerful feature within OmniWOT that empower users to:
- Visualize IoT device locations
- Track sensor data in real-time
- Create custom dashboards for monitoring
- Integrate with other IoT services